Home About Work Thinking Work With Me Mentorship Let's Talk
Work

Real problems. Real systems.

Four projects, documented in full — the problem, what I actually did, and what changed because of it.

Operations · National Lottery Nigeria

From Fragmentation to Clarity: Centralising Customer Operations

Problem

User activity was increasing, but resolution time wasn't keeping pace. The same issues kept recurring — not because of volume, but because information was spread across multiple tools with no single, reliable view.

Intervention

  • Centralised operational system with a unified dashboard for tickets, workflows, and performance
  • Standardised issue categorisation and assignment
  • Logic-based task distribution to cut bottlenecks
  • Clearer escalation and resolution pathways
  • Interpreted Power BI reports from the Business Intelligence team to surface recurring-issue patterns

Result

  • Reduced repeated issues through better tracking
  • Full visibility across support operations
  • Faster, more consistent team decision-making
80%MTTR Reduction
35%Capacity Lift, No New Headcount
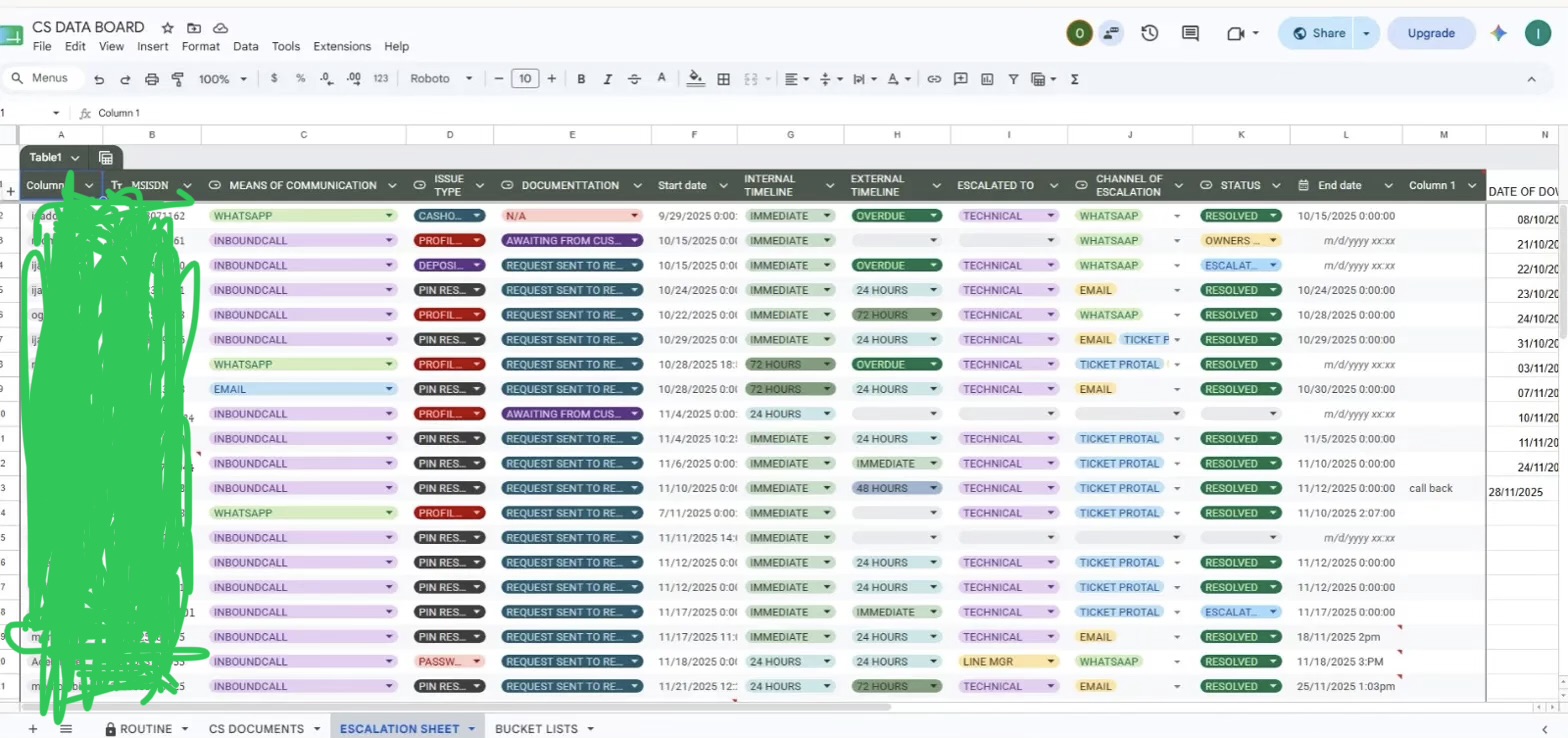
CS Data Board
The centralised CS Data Board — the actual unified tracker behind this system, logging every case by channel, timeline, and escalation status. (Customer data redacted for privacy.)
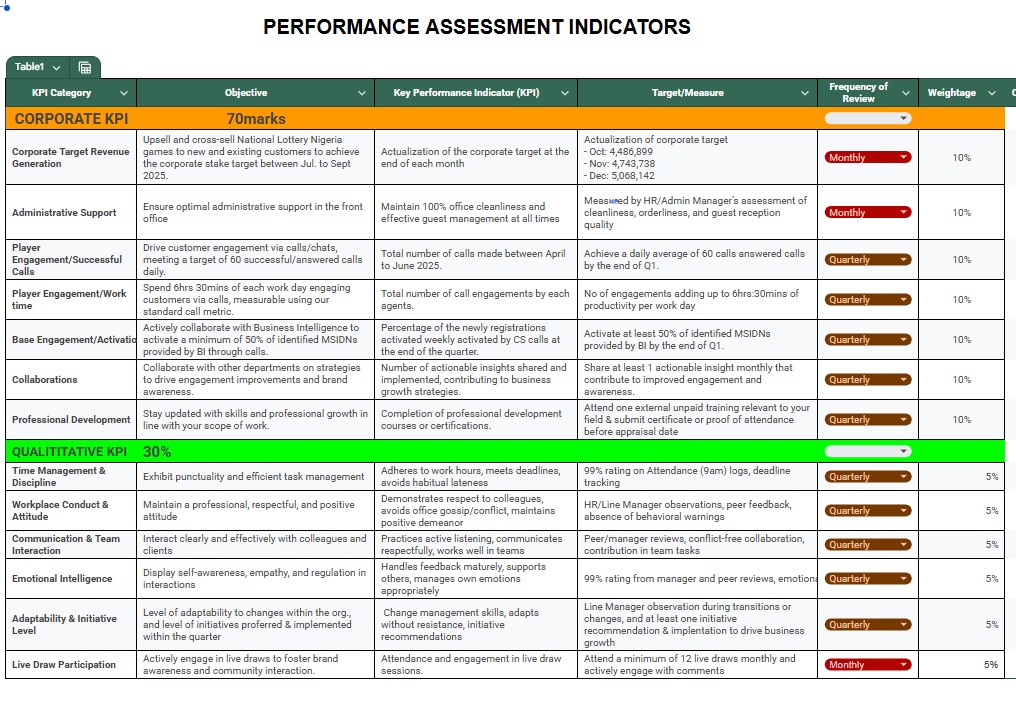
KPI Framework
The KPI framework built for this governance rebuild — corporate and qualitative indicators, weighted and reviewed on a defined cadence.
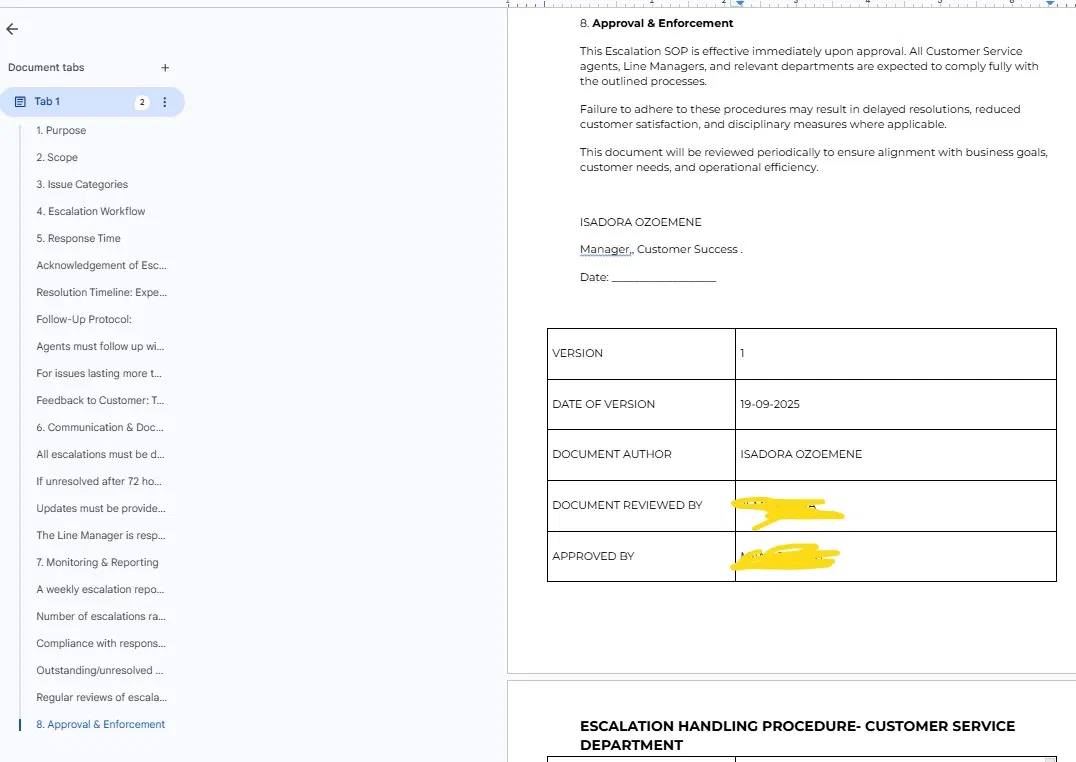
Escalation SOP
The Escalation Management SOP — clear ownership, response timelines, decision pathways. (Details blurred for confidentiality.)
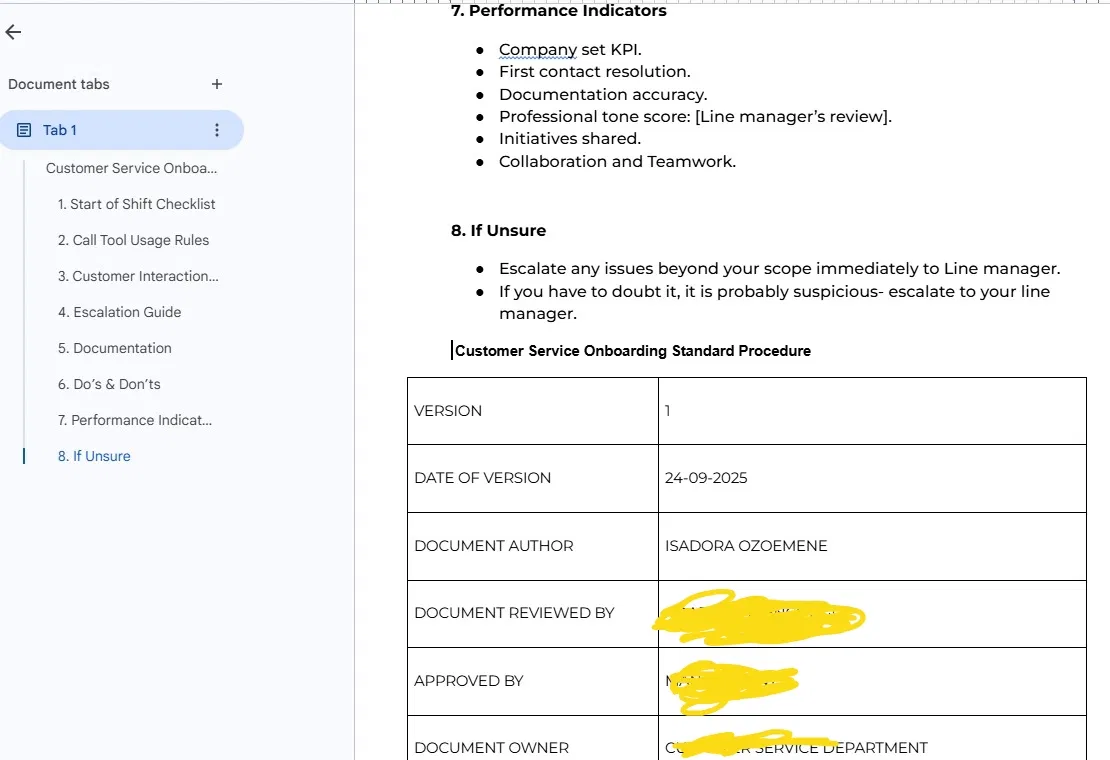
Onboarding SOP
The Onboarding SOP used to bring new team members up to speed on the centralised system.
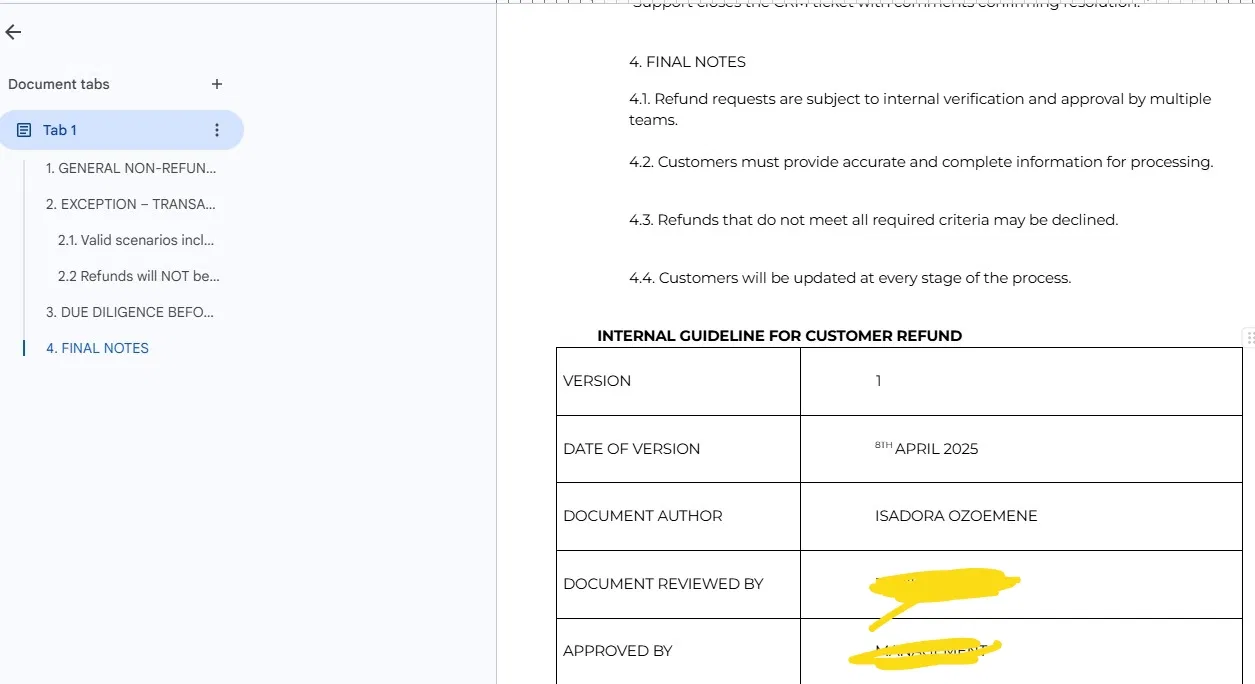
Refund Guideline
The internal Refund Guideline — one of the governance policies standardised as part of this rebuild.

What This Reinforced

"Growth doesn't slow teams down. Unstructured systems do."
Customer Experience · National Lottery Nigeria

Improving Customer Experience on a USSD Platform

Problem

On a USSD platform, confused users don't complain — they simply stop. A large share of support requests traced back to the same points in the user journey. It looked like a volume issue; it was actually a friction issue.

Intervention

  • Shifted focus from responding to users to understanding the journey itself
  • Traced recurring requests back to specific drop-off points
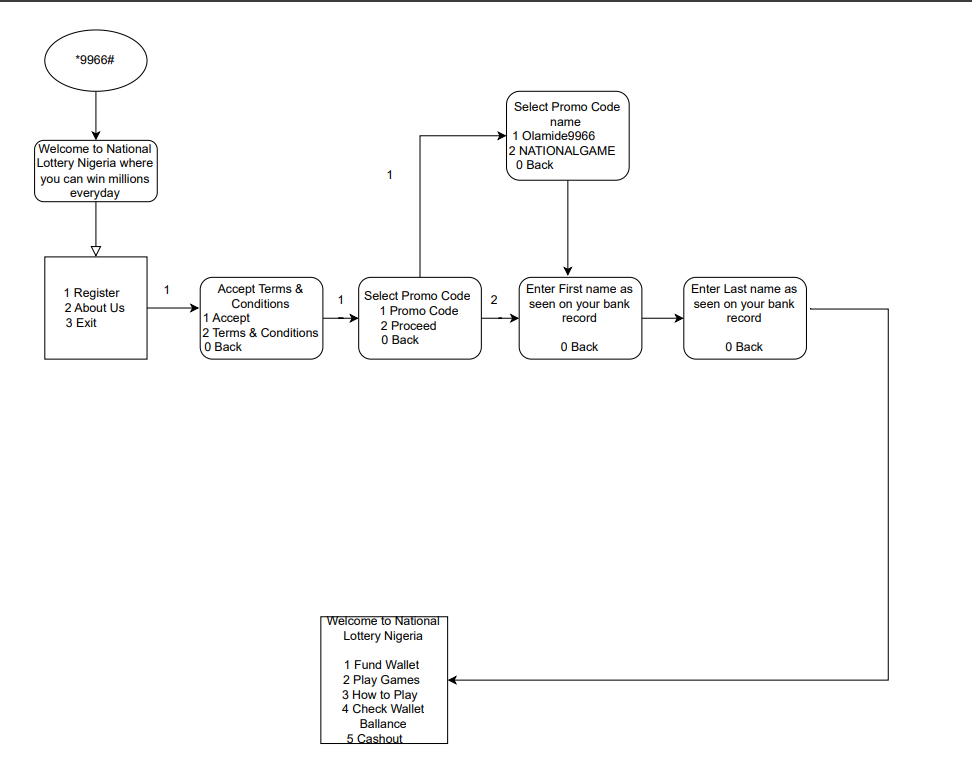
  • Mapped the full USSD flow to find unclear steps
  • Simplified interactions at each friction point
  • Fed insights directly to product and operations

Result

  • Fewer repeated queries at known friction points
  • Clearer interactions across the USSD flow
  • Support shifted from reactive to preventive
USSD Flow Diagram
The USSD flow, mapped step by step to trace exactly where users were getting stuck.
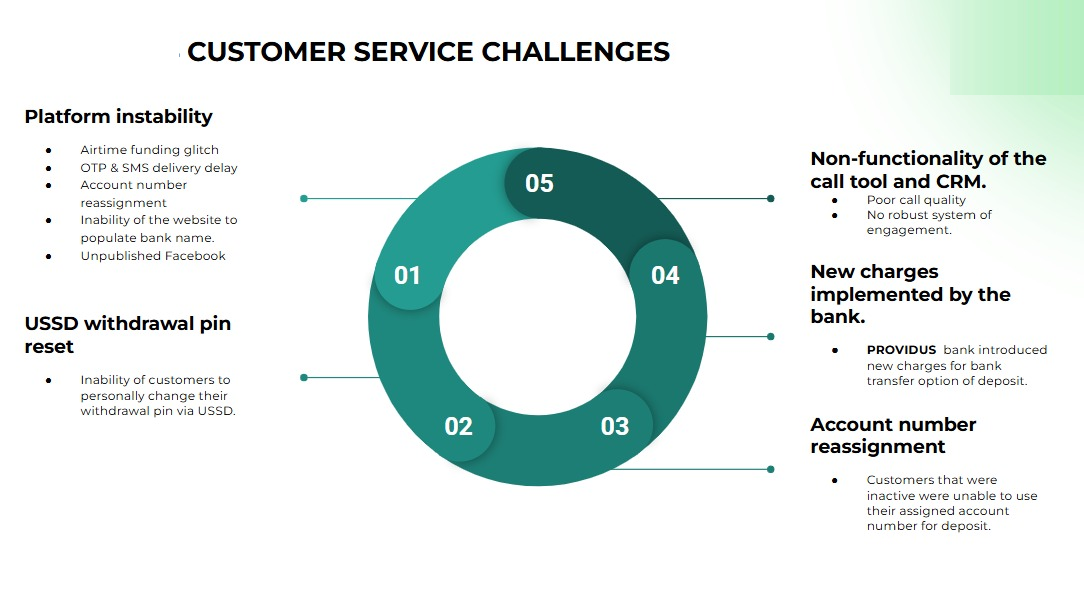
Customer Service Challenges Diagnostic
The five friction points this diagnosis surfaced.
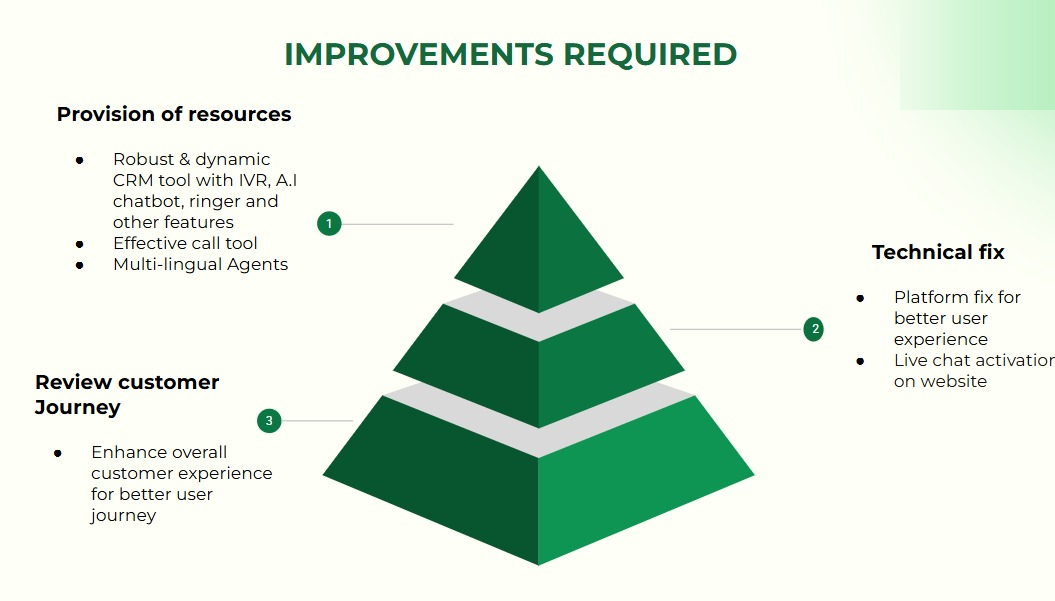
Improvements Required Pyramid
The resulting action plan — resourcing, technical fixes, and journey redesign, in priority order.

What This Reinforced

"In environments where users don't give feedback, behaviour becomes the loudest signal."

Data & Reporting · National Lottery Nigeria

Using Data to Improve Customer Operations Visibility

Problem

As activity increased, tracking performance got harder — not from a lack of data, but a lack of visibility. Data points existed across tools, but nowhere in one place.

Intervention

  • Consolidated ticket trends, resolution times, and recurring issues into a single reporting view
  • Interpreted Power BI dashboards alongside CDR and support data
  • Visualised insights for fast leadership decisions
  • Established the report as the team's operational source of truth

Result

  • Full visibility across every support metric
  • Faster identification of emerging trends
  • Data-driven decisions at the operational level
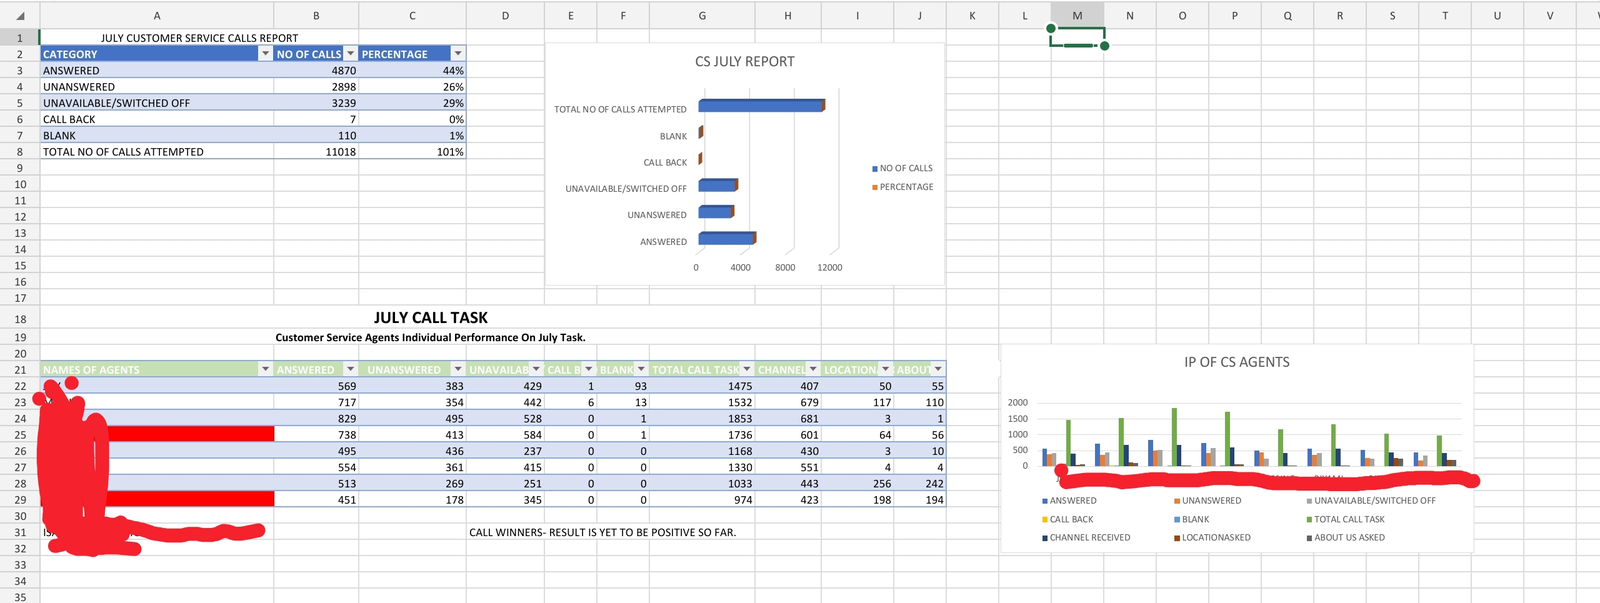
CS Quarterly Report Dashboard
The monthly reporting structure built to track call categories, trends, and team performance in one place. Agent names redacted for privacy.
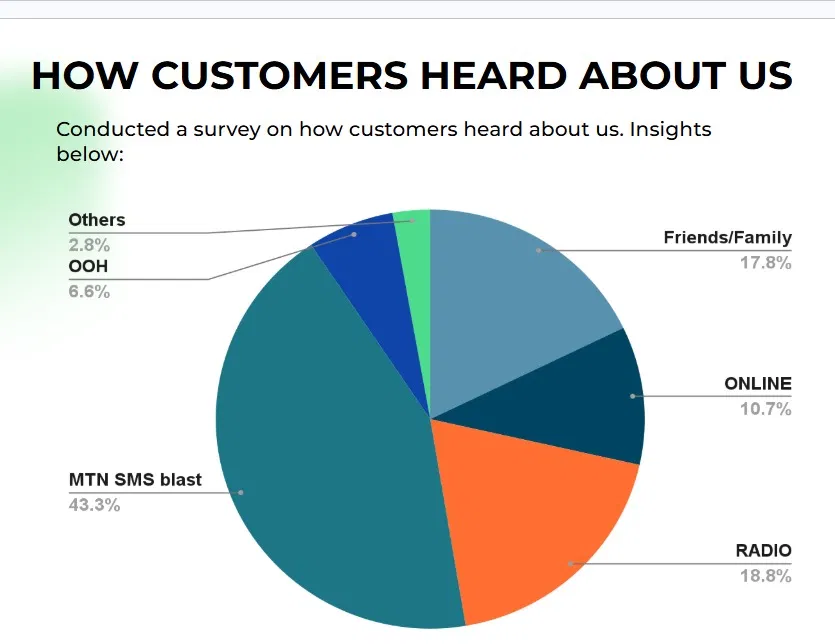
Customer Source Breakdown
A customer-acquisition-source survey, built to show leadership exactly where engagement was coming from.
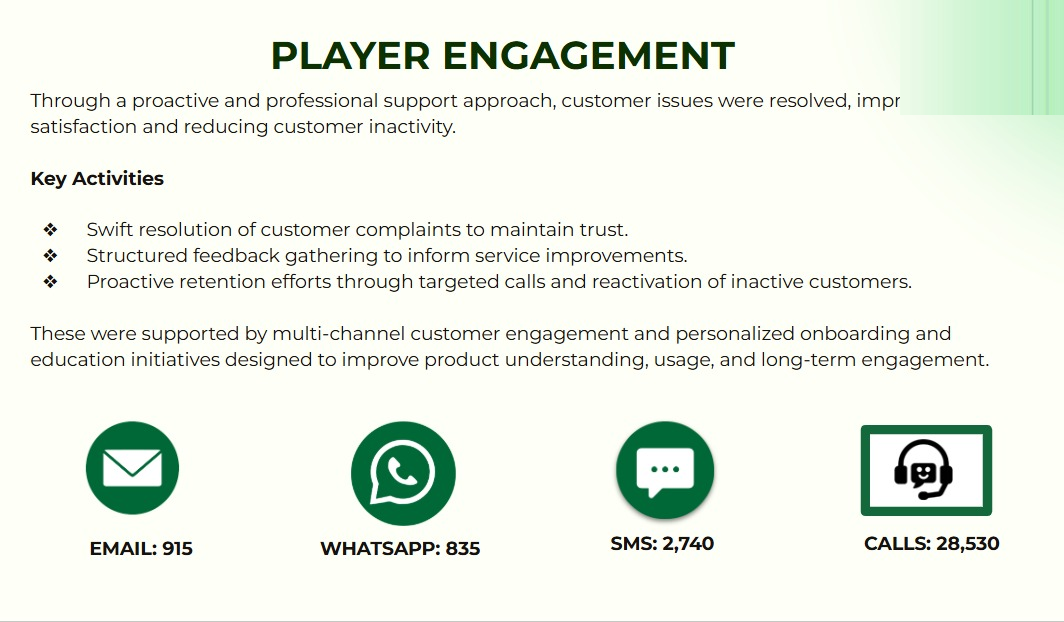
Player Engagement Summary
The resulting engagement visibility — thousands of monthly customer touchpoints tracked across every channel.

What This Reinforced

"Data is only useful when it's visible and actionable."

Project Management · TechCrush Capstone (Not National Lottery Nigeria)

Implementing an Electronic Medical Appointment System

Role

Project Manager, leading a cross-functional team of 30 through an 8-sprint Agile rollout for a fictional hospital client, as part of a Project Management certification capstone.

Methodology

  • Agile/Scrum across 8 sprints
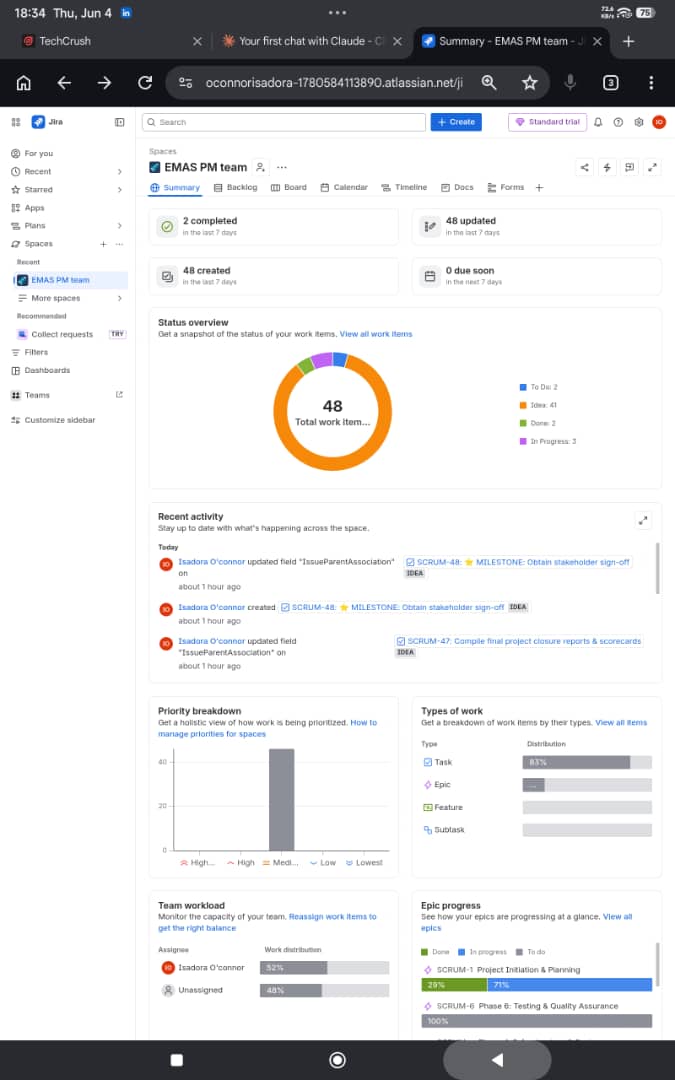
  • Jira for sprint planning and tracking — 48 tasks managed
  • Stakeholder charter, sign-off, and kickoff process
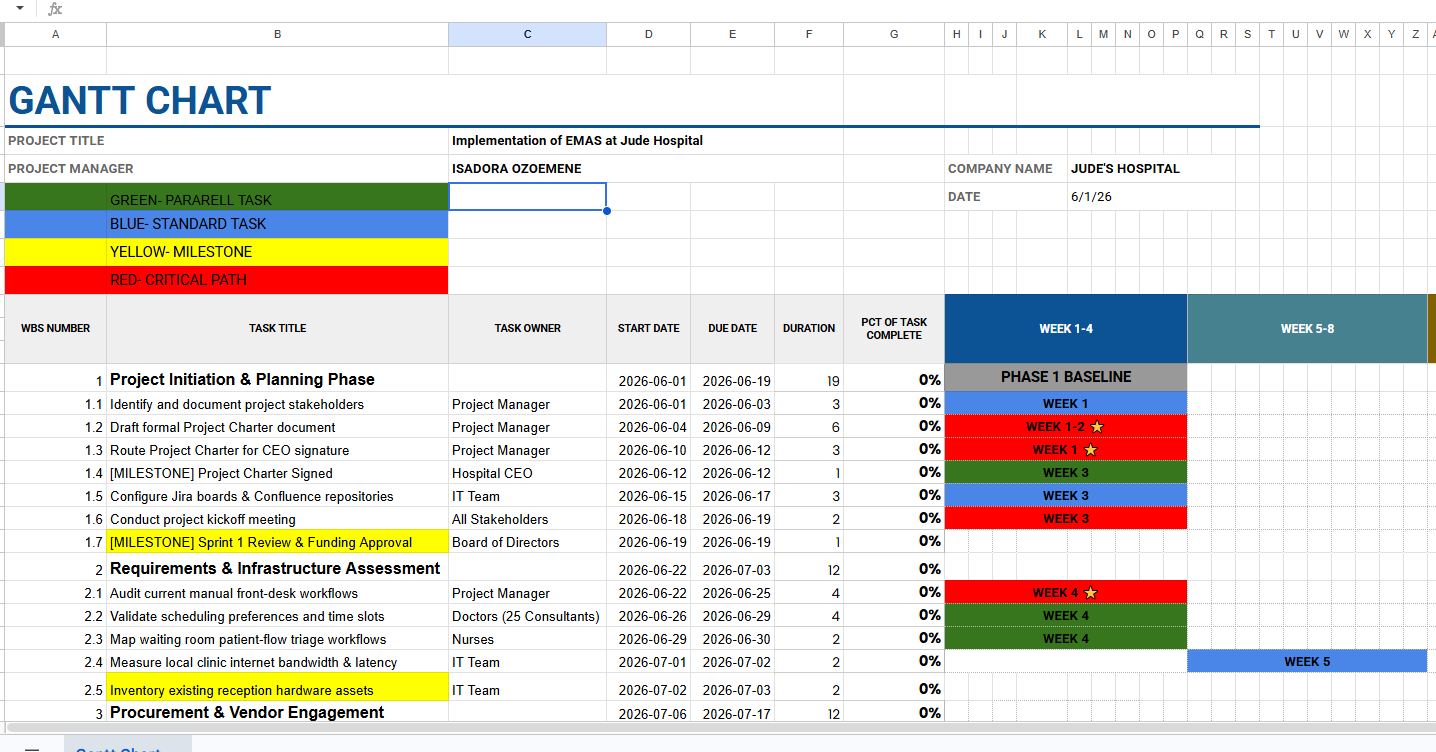
  • Gantt-based phase planning with critical-path tracking

Deliverables & Outcome

  • Full project charter and stakeholder sign-off
  • Complete sprint-by-sprint implementation plan
  • Live Jira board with 100% task visibility
EMAS Gantt Chart
The Gantt chart planning the 8-sprint rollout, phase by phase.
Jira Project Summary
The Jira board tracking all 48 tasks across the project's lifecycle.
Want to Discuss This Work?

Happy to walk through any of it.

The decisions, the constraints, what I'd do differently — I'll go as deep as is useful.

Start the Conversation